
The One-Liner
Singapore Exchange does not compete for market share. It is the market. And it collects a toll on every transaction that passes through.
I first noticed SGX years ago, almost by accident. Back then, I was looking at the Nasdaq (the index, the exchange, the thing you see on CNBC) and came across NDAQ on a U.S. screener. It took me a moment to realise NDAQ was a separate listed company. The Nasdaq exchange itself, tradeable as a stock.
That stopped me. If the U.S. exchange was publicly listed, was Singapore's?
I typed "Singapore Exchange" into the search bar, meaning to look up the SGX website, and S68 popped up instead. A listed company. The exchange itself, available for ownership.
I peeked at the figures then. The margins looked almost too clean. ROE above 30%. A structural monopoly. I bookmarked it and moved on, distracted by other positions, other priorities.
Years passed. When I came back to it, the stock had exploded.
The question now isn't whether I missed the easy entry. I did. The question is whether the business, not the price, still justifies a closer look.
What This Business Actually Is
Singapore Exchange Limited (SGX Group, SGX:S68) is Singapore's sole securities and derivatives exchange. Incorporated in 1999 and listed on its own exchange in 2000, SGX is not simply a venue where buyers and sellers meet. It is the infrastructure through which capital flows in and out of Singapore's financial system. 1
The business operates across four segments: Equities – Cash, Equities – Derivatives, Fixed Income, Currencies and Commodities (FICC), and Platform and Others (market data, connectivity, indices). But the segmentation understates how tightly integrated the model is. SGX spans the full trading lifecycle: listing, trading, clearing, settlement, custody. Every transaction generates fee income at multiple points. 2
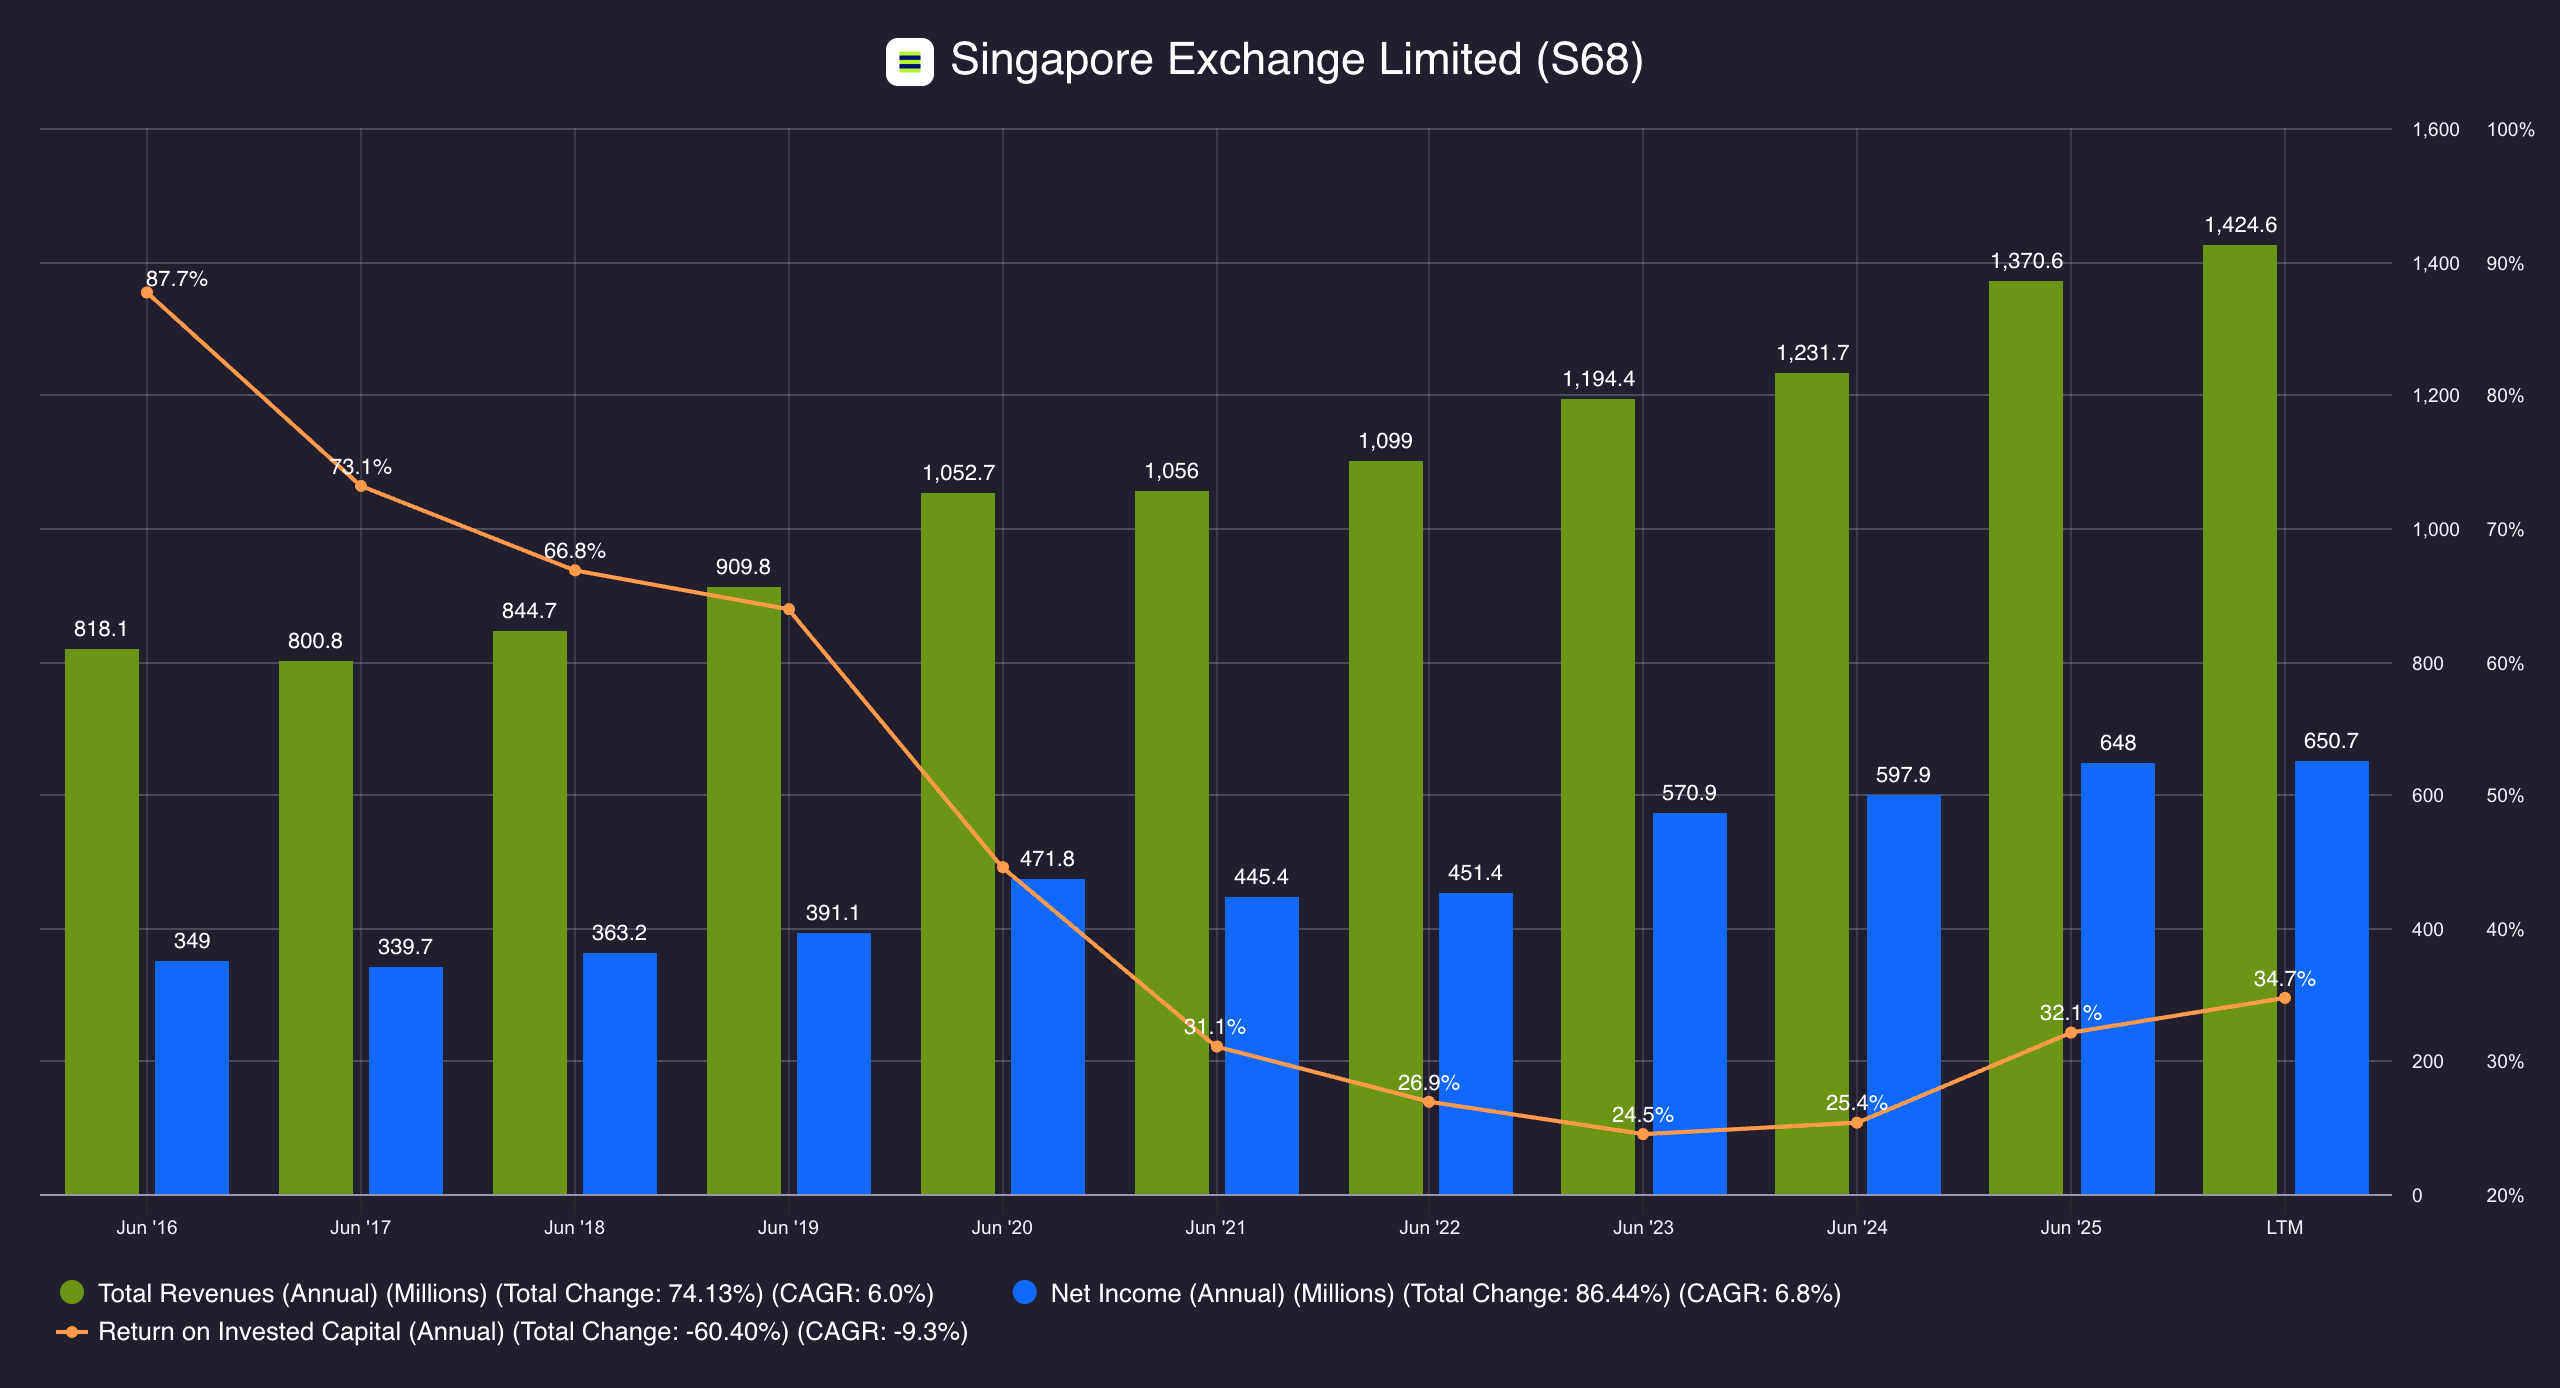
The numbers confirm the model is working. In FY2025 (year ending 30 June 2025), SGX reported operating revenue of S$1.37 billion, up 11.3% year-on-year, and adjusted net profit of S$609.5 million, up 15.9%. The strongest year in the exchange's listed history. 3
The business doesn't need to convince anyone to use it. That's the point. SGX isn't selling a product. It's operating the system.
The harder question is whether the price still leaves room for returns to compound into shareholders' hands, or whether the market has already claimed them.
Why This Business Exists (and Why It Persists)
The surface-level answer is straightforward: SGX holds the exclusive licence to operate Singapore's securities and derivatives exchange. No competitor can legally offer an equivalent service without a regulatory mandate that, by design, is not available. This isn't a dominant market position. It's a statutory monopoly, granted and overseen by the Monetary Authority of Singapore. 4
But calling it a "regulatory moat" and stopping there misses what makes it durable.
Network effects
Liquidity attracts liquidity. Once SGX established itself as Asia's primary offshore venue for China and India exposure (the FTSE China A50 futures, GIFT Nifty, iron ore swaps, INR/USD FX), those contracts became self-reinforcing. In FY2025, currency derivatives volumes grew 49.7% to 73.6 million contracts; commodity derivatives rose 6.2% to 65.3 million contracts. Displacing SGX would mean rebuilding the entire institutional participant base, pricing infrastructure, and clearing relationships somewhere else. ^5^ ^6^
Infrastructure lock-in
Clearing and settlement aren't ancillary to trading. They're the nervous system. SGX's Central Depository handles post-trade functions for equities, including the daily buying-in process: when a seller fails to deliver, SGX purchases the shares on the open market and completes settlement on behalf of the buyer. That's not a side function. It's the backstop that makes the system trustworthy. Participants connect through years of integration, compliance work, and capital commitment. Switching costs aren't financial. They're operational and relational. ^7^
Recurring data and connectivity revenue
Market data, indices, and co-location services generated S$238 million in net revenue in FY2025, up 3% year-on-year, with data income up 8% and connectivity up 11.8%. Unlike trading fees, this revenue doesn't swing with volume. It's subscription-like: recurring, sticky, and it grows as more participants connect. Co-location demand reflects institutions building permanent, low-latency links to SGX. Every new connection makes the next one more likely. ^8^
The regulatory licence is the entry barrier. Network effects, infrastructure lock-in, and recurring data revenue are what make it durable.
SGX doesn't win by competing. It wins by being unavoidable.
SGX doesn't win by competing. It wins by being unavoidable.
The Moat's Real Boundary
The honest assessment requires naming where the moat ends. SGX's dominance in Singapore is unconditional. Its position in derivatives, specifically Asia-themed index and commodity futures, is real and growing. But the equities listings market has been a different story.
Delistings outpaced new listings for years. In 2024, 20 companies delisted while only 4 new ones listed. In the first four months of 2025, at least 8 SGX-listed companies announced potential delisting and at least 11 received privatisation offers, with low liquidity and undervaluation cited as primary reasons. The number of listed companies reached a two-decade low by 2024. 9 10 11
Early signs suggest intervention may be working. In 1H FY2026 (July–December 2025), SGX recorded 15 new equity listings, compared to just 5 in the prior-year period, raising S$3.0 billion. Total market capitalisation rose 22.3% to S$1.06 trillion; retail participation hit a four-year high. The S$5 billion MAS Equity Development Programme and reforms from the Equities Market Review Group appear to be gaining traction. 12 13
This isn't a resolved problem. Delistings and privatisations continue. But the trajectory has shifted. Whether it sustains is the open question.
The moat is intact. But one part of the system, listings, has been quietly eroding. That's the tension.
How It Converts Structure Into Cash
SGX is not a trading business. It is a multi-layer fee stack built on a single transaction.
Every time capital moves through Singapore's financial system, SGX collects: at listing, at trading, at clearing, at settlement, at custody. The structural necessity of market access converts directly into recurring fee income, at margins most businesses will never see.
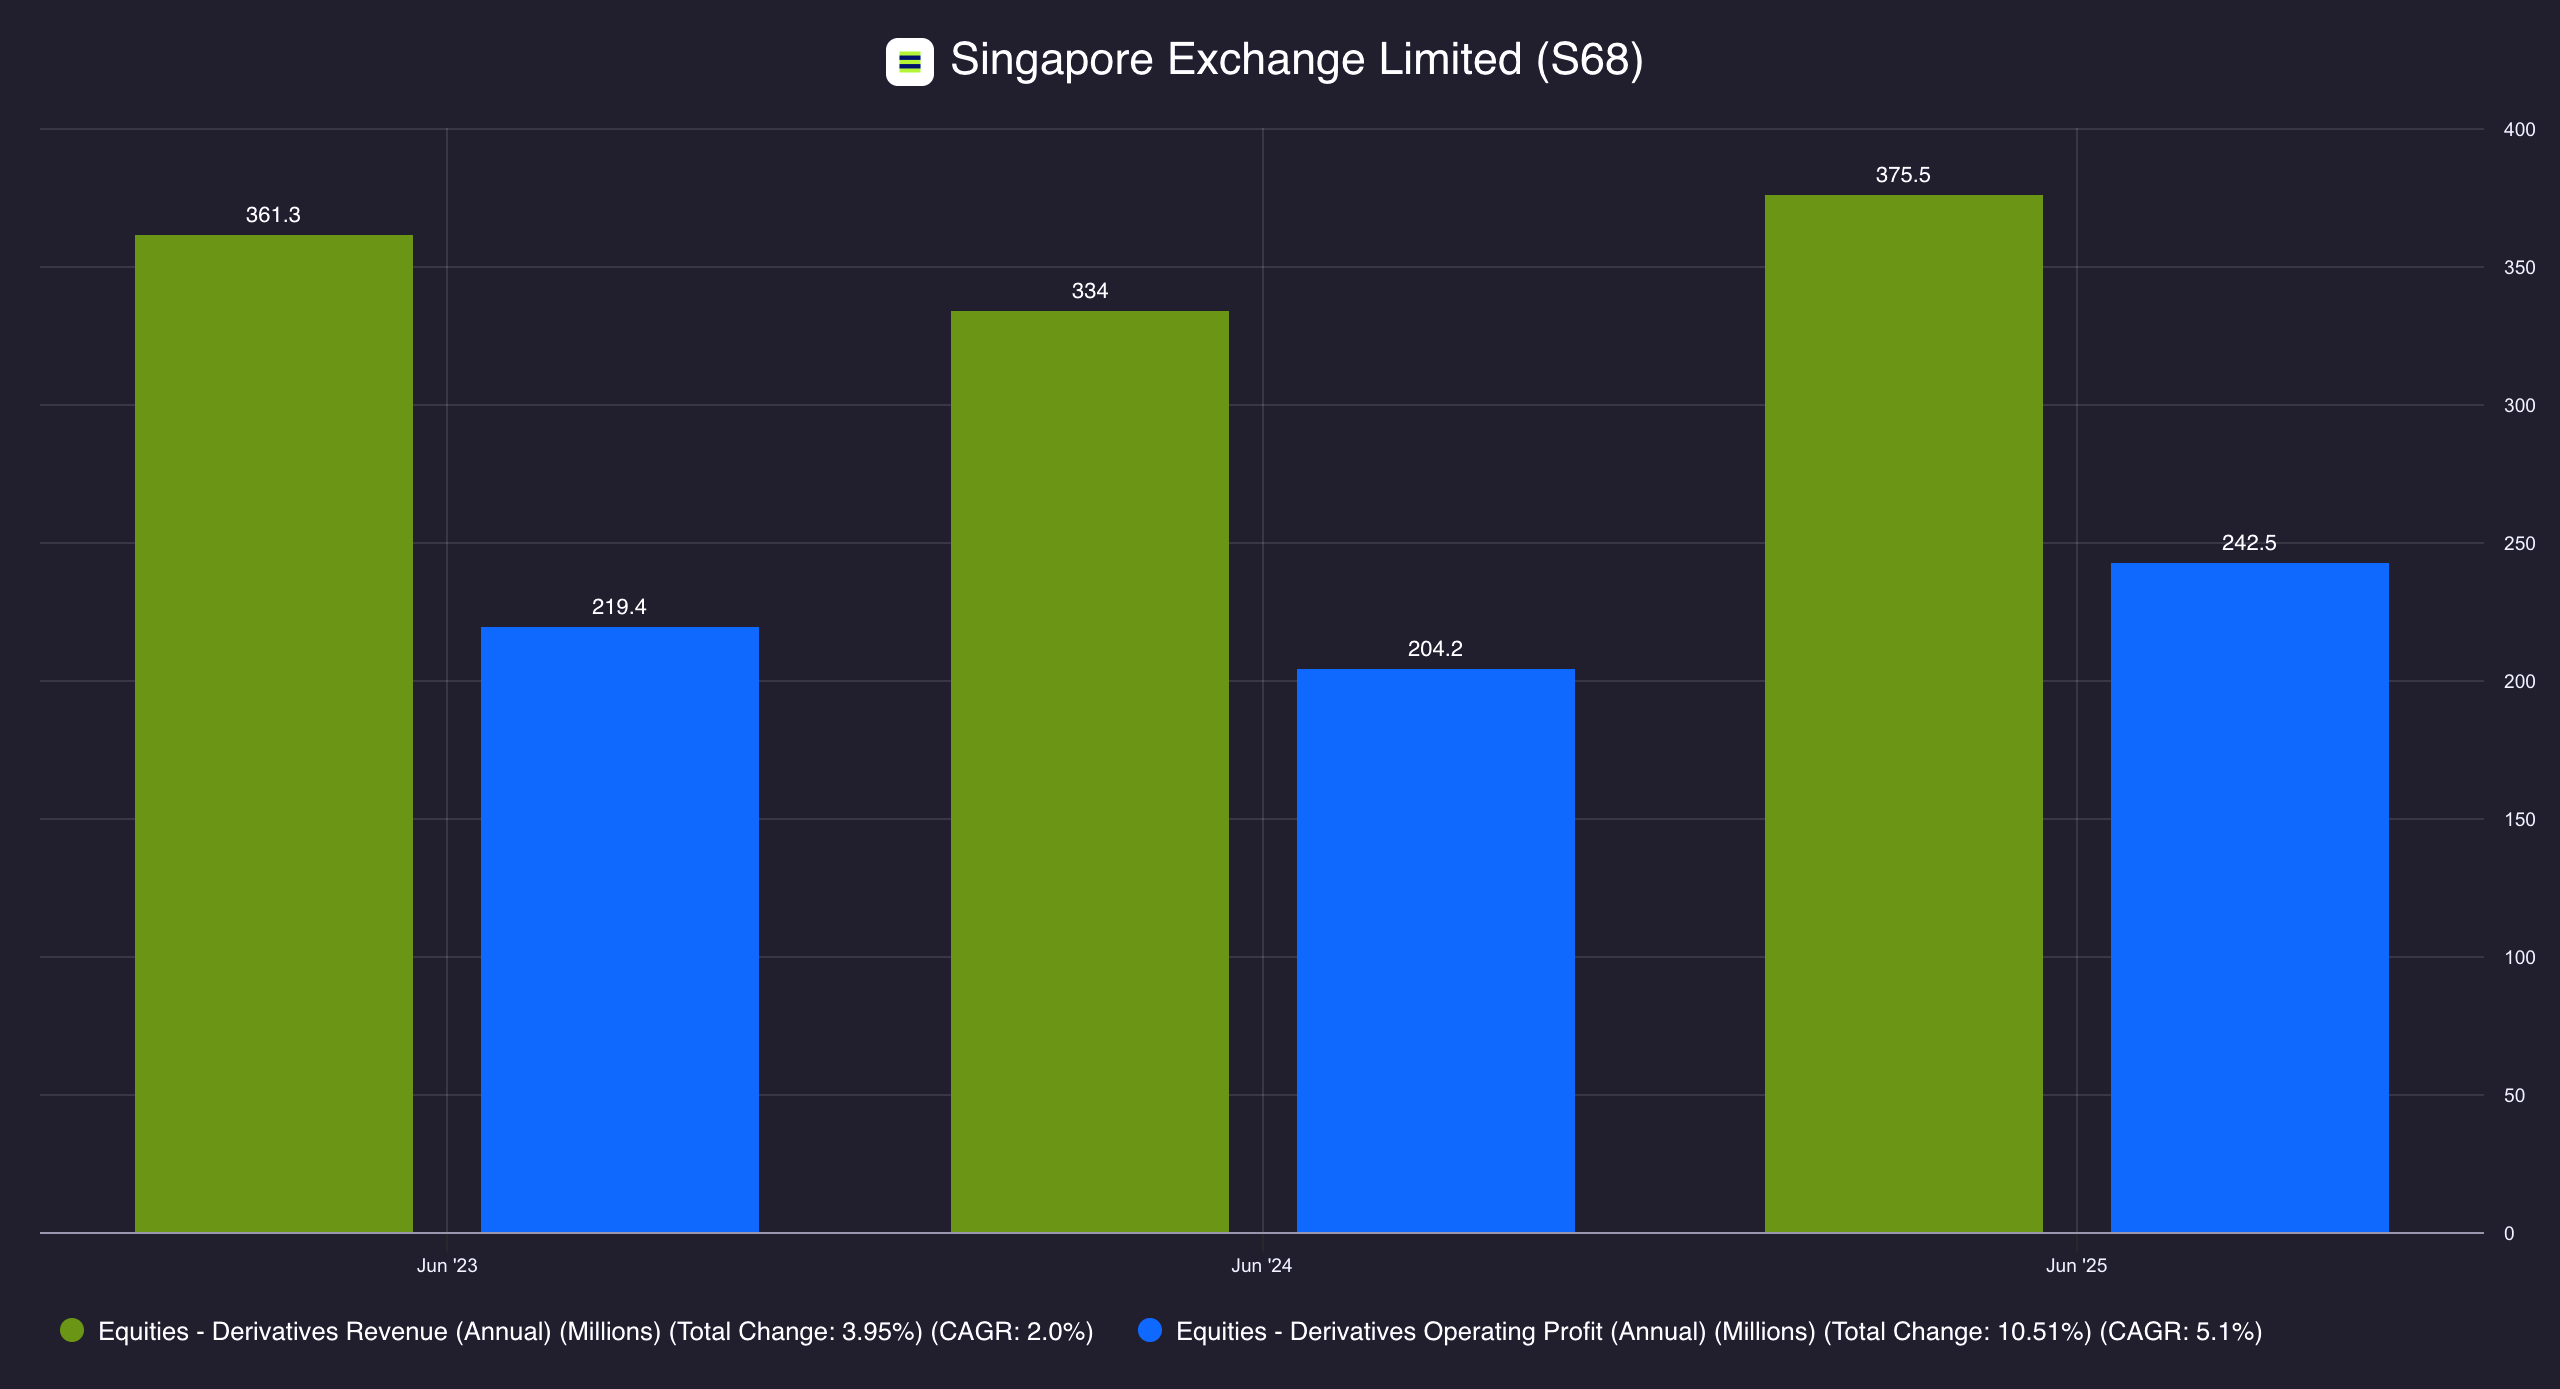
Trading fees. Every transaction generates a fee across equities, derivatives, or FX. In FY2025, Equities – Cash net revenue grew 18.7% to S$392.7 million, driven by a 26.5% increase in securities daily average traded value (SDAV) to S$1.34 billion. Equities – Derivatives net revenue grew 13.8% to S$345.9 million, with volumes up 10.3% to 175.8 million contracts. 14 15
Clearing and settlement fees. Post-trade services (clearing, settlement, custody, buying-in) generate revenue at every step. OTC FX average daily volume grew 28.5% to US$143 billion in FY2025, the highest year-on-year ADV growth among peer exchanges, with SGX FX now among the top three exchange-backed OTC FX venues globally. That momentum has continued: 1H FY2026 ADV reached US$180 billion, up 32.3% year-on-year. 16
Market data and connectivity. The Platform segment sells real-time data feeds, indices, and co-location services. This revenue is recurring, high-margin, and grows with every new participant. In 1H FY2026, market data revenue grew 15.5%, accelerating from the prior year as repricing and fee recoveries took effect, while connectivity grew 10.8%. 17
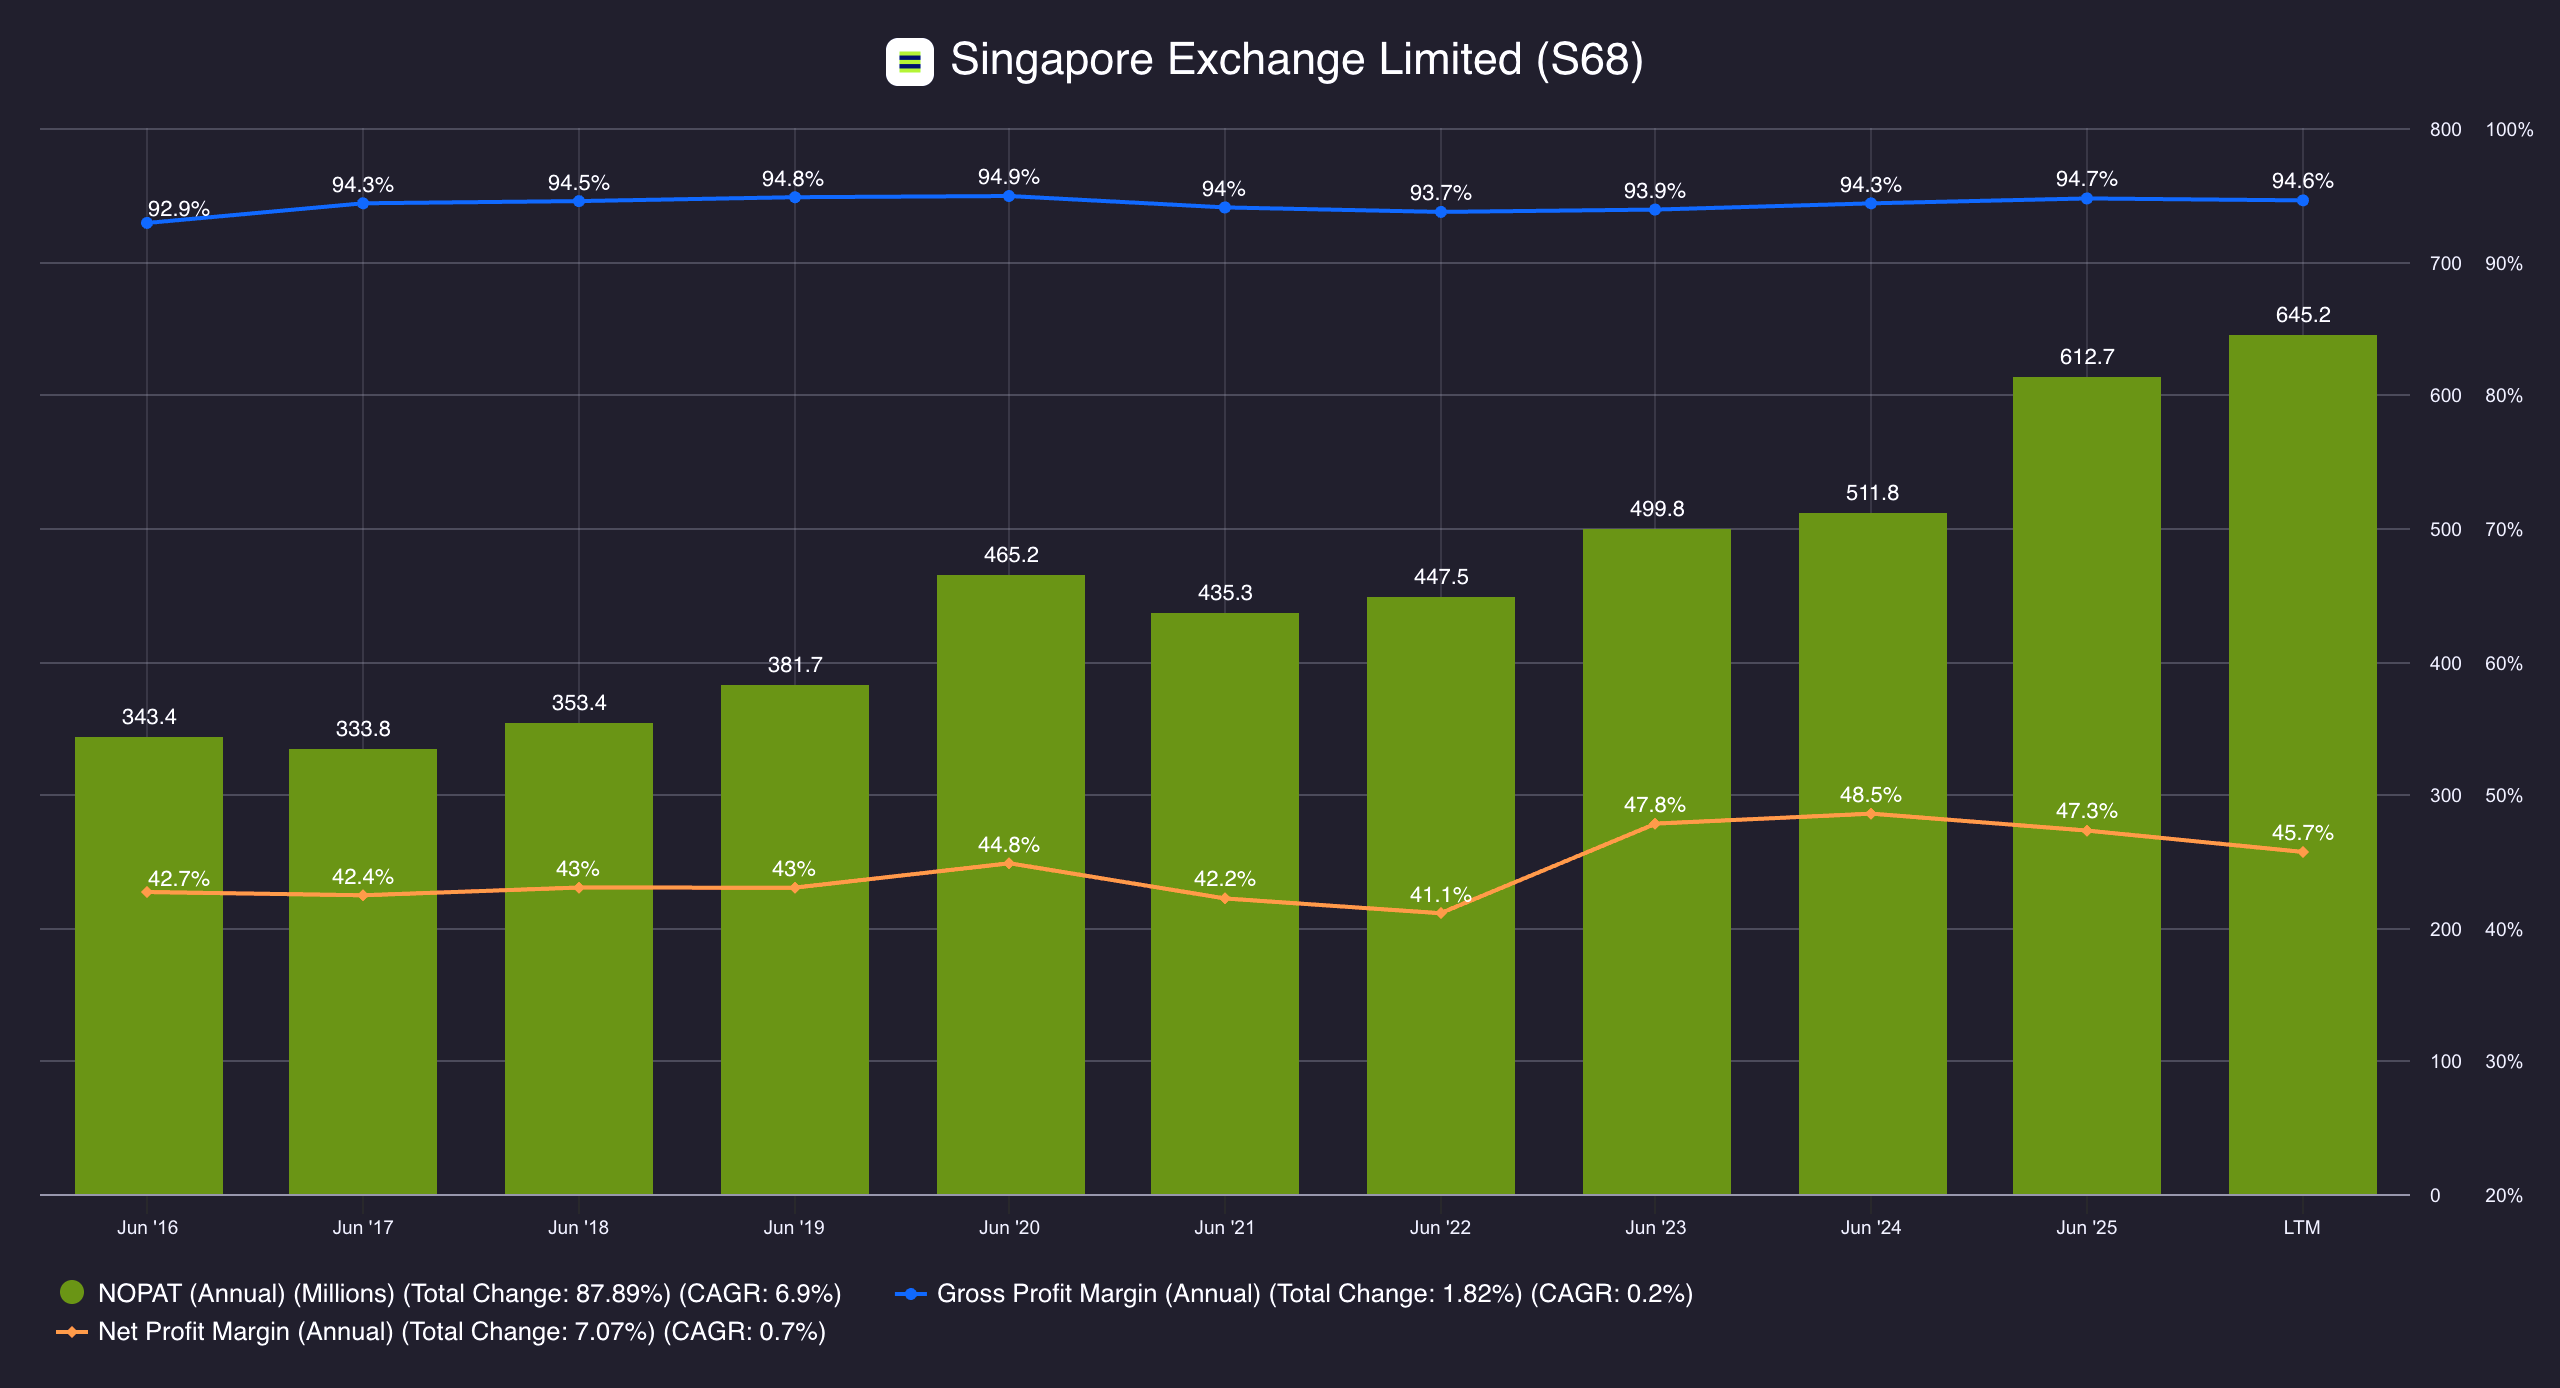
Operating leverage. Once infrastructure is in place, each additional trade clears at near-zero marginal cost. Adjusted NPAT margin improved from 45.3% to 47.0% in FY2025; operating margin from 54.0% to 58.2%.18 Net profit margin above 40% isn't an anomaly — it's the structural output of a monopoly on a capital-light base.
TL;DR
SGX is the company that runs Singapore's financial markets. Think of it like a shopping mall: it doesn't sell the products, it owns and operates the space where buying and selling happens. Every stock trade, every futures contract, every bond transaction that moves through Singapore's financial system passes through infrastructure that SGX built and controls.
The revenue model follows from that. It charges companies to list on its exchange and takes a cut of every equity trade. It earns fees from derivatives (futures and options on Asian indices, currencies, and commodities), which is actually its largest segment. It operates trading platforms for fixed income, currencies, and commodities. And it sells market data and connectivity access to institutions and brokers who need to plug into its systems. It doesn't take risk on any of the assets being traded. It's a toll booth on the flow of capital through Southeast Asia. Every time something moves through its pipes, SGX gets paid.
SGX Financial Snapshot (FY2025)
| Metric | Value |
|---|---|
| Operating Revenue | S$1.37 billion |
| Revenue Growth (YoY) | +11.3% |
| Adjusted NPAT | S$609.5 million |
| Adjusted NPAT Growth (YoY) | +15.9% |
| Adjusted NPAT Margin | ~47.0% |
| EPS (reported) | 60.6 cents |
| Total FY2025 Dividend | 37.5 cents/share |
| Dividend Yield | ~2.0–2.2% |
| ROE | ~32.6% |
| ROIC | ~33.7% |
| Debt-to-Equity | ~0.37x |
Sources: SGX FY2025 Annual Report; StockAnalysis; Alpha Spread.19 |
1H FY2026 Update
Interim results (July–December 2025) confirm momentum. Net revenue rose 7.6% to S$695.4 million; adjusted NPAT grew 11.6% to S$357.1 million. Equities – Cash led with 16.2% net revenue growth on 19.5% higher SDAV. FICC net revenue rose 12.5%, driven by currency derivatives (+17.6% volume) and commodities (+24.2% volume). The Board declared a 2Q interim dividend of 11.0 cents — in line with its published progressive dividend schedule through FY2028.20
CEO Loh Boon Chye has led SGX since July 2015, pivoting it from a Singapore-centric equities exchange into a multi-asset derivatives and data hub for Asia. The acquisitions under his tenure — BidFX (FX trading), Baltic Exchange (shipping benchmarks), Scientific Beta (smart beta indices) — reflect a deliberate build-out, though execution has been uneven. In 1H FY2026, SGX recorded a S$15 million goodwill impairment on Scientific Beta due to continued underperformance.21
Capital returns are disciplined. SGX published a progressive dividend schedule: 37.5 cents per share in FY2025 (up 8.7% year-on-year), with committed quarterly increases of 0.25 cents through FY2028 — implying roughly 52.5 cents per share by FY2028.22 The balance sheet is conservative: debt-to-equity at 0.37x, net cash positive. For a regulated infrastructure entity, that conservatism is part of the product.23
Why This Might Still Disappoint
Nothing here needs to go wrong for returns to disappoint.
Even excellent infrastructure businesses can produce mediocre shareholder returns.
Growth maturity. If derivatives volumes plateau and the listings market doesn't recover, revenue growth slows to GDP-like rates. The valuation compresses to match.
Valuation already discounting quality. At 22–25x earnings, SGX is priced as a premium compounder. If the market already sees what you see, the edge disappears.
Concentration risk. The strongest parts of the business (A50, Nifty, iron ore) are also the most exposed to regulatory or competitive shifts offshore. In 1H FY2026, equity derivatives net revenue declined 5.6% as Nikkei 225 volumes fell 24% and GIFT Nifty dipped 5.5%. These products remain anchors, but they're not immune to softness. 24
The moat is real. The question is whether the moat's returns still belong to new buyers — or whether they've already been priced away.
Where's the Risk?
SGX is a toll booth on the flow of capital through Southeast Asia. It doesn't take risk on the assets being traded. It just charges every time something moves through its infrastructure. So where does the risk actually sit?
The risk isn't on the assets. It's on the traffic.
SGX doesn't lose money if a stock crashes. It doesn't hold positions. But if fewer people trade, because markets are quiet, investor confidence is low, or capital leaves Singapore entirely, the toll booth collects less. The infrastructure still exists. The fixed costs still run. Revenue just drops. That's volume dependency: SGX's income is largely transactional. No activity, no fees.
The second risk is relevance.
A toll booth only works if it's on the road people actually use. SGX has faced a real, ongoing question: are companies choosing to list here, or are they going to Hong Kong, New York, or staying private? Fewer listings means a smaller market, which means less trading, which compounds the first risk.
The third is competition and technology.
Trading infrastructure is no longer physically anchored. Alternative platforms, dark pools, and the general digitisation of markets mean the "only road in town" advantage erodes over time if SGX doesn't keep investing
The toll booth metaphor holds. But the risk is that the highway gets less traffic, a new road opens nearby, or drivers start questioning why they're paying the toll at all.
To assess these risks, and whether SGX can sustain its returns, I'll be watching a few things. Whether the 15 new listings in 1H FY2026 mark a real inflection or a one-off. Whether derivatives concentration in A50 and Nifty becomes a vulnerability. Whether data and connectivity pricing power holds beyond the current repricing cycle. And whether MAS keeps the regulatory latitude wide enough for margins to stay intact.
To assess these risks, and whether SGX can sustain its returns, I'll be watching a few things. Whether the 15 new listings in 1H FY2026 mark a real inflection or a one-off. Whether derivatives concentration in A50 and Nifty becomes a vulnerability. Whether data and connectivity pricing power holds beyond the current repricing cycle. And whether MAS keeps the regulatory latitude wide enough for margins to stay intact.
The business is exceptional. The question is whether exceptional
has already been priced to exhaustion.
If the system continues to run, SGX will continue to earn.
The ownership question is whether that outcome still belongs to new shareholders, and what would have to remain true for that to hold.
~ This is the opening thesis. ~
Continue to the First Principles Analysis.
Singapore Exchange Ltd.(SGX: S68): First Principles Analysis
Singapore Exchange Ltd. SGX (S68.SI) analysed using a first-principles framework assessing business quality, management and long-term ownership risk.
Footnotes:
Footnotes (25)
- Singapore Exchange Limited was incorporated on 1 December 1999 as a holding company, formed from the merger of the Stock Exchange of Singapore (SES), the Singapore International Monetary Exchange (SIMEX), and the Securities Clearing and Computer Services Pte Ltd (SCCS). It was listed on its own exchange in 2000. Singapore Exchange, Company History. sgx.com
- SGX Group operates across four reportable segments: Equities – Cash, Equities – Derivatives, Fixed Income Currencies and Commodities (FICC), and Platform and Others. SGX FY2025 Annual Report. investor.sgx.com
- SGX FY2025 Annual Report (year ending 30 June 2025). Operating revenue of S$1,370.6 million (+11.3% YoY); Adjusted NPAT of S$609.5 million vs S$525.9 million in FY2024 (+15.9%). SGX FY2025 Results Presentation. investor.sgx.com
- SGX holds the exclusive licence for securities and derivatives trading in Singapore, granted under the Securities and Futures Act. MAS regulatory framework. mas.gov.sg
- SGX's flagship derivative contracts include the FTSE China A50 Index Futures, GIFT Nifty Futures (India), INR/USD FX Futures, and iron ore derivatives. SGX FY2025 Annual Report. investor.sgx.com
- Currency derivatives volumes increased 49.7% to 73.6 million contracts; commodity derivatives volumes increased 6.2% to 65.3 million contracts in FY2025. SGX FY2025 Annual Report. investor.sgx.com
- SGX's Central Depository (CDP) operates the buying-in process to guarantee settlement finality. When a seller fails to deliver shares by settlement date, SGX purchases the shares on the open market to complete settlement on behalf of the buyer. The defaulting seller bears the cost. SGX Company Announcements – Buying-In Executed (March 2026). sgx.com
- Platform and Others segment net revenue of S$238 million in FY2025, up approximately 3% YoY. Market data income grew 8%; connectivity revenue grew 11.8%. SGX FY2025 Results Presentation. investor.sgx.com
- In 2024, 20 companies delisted from SGX against only 4 new listings. Loeb & Loeb – "Considering a U.S. Listing? What Asian Issuers Should Know" (May 2025). loeb.com
- In the first four months of 2025, at least 8 SGX-listed companies announced potential delisting, and at least 11 received privatisation offers. Primary reasons cited: lack of liquidity, limited market visibility, and undervaluation. Loeb & Loeb (citing The Straits Times, May 5, 2025). straitstimes.com
- The number of listed companies on SGX reached a two-decade low by 2024. ts2.tech – "Singapore Exchange (SGX) Stock: 2025 Share Price, Record Profits and Crypto Futures Outlook" (December 5, 2025). ts2.tech
- In 1H FY2026 (July–December 2025), SGX recorded 15 new equity listings raising S$3.0 billion (vs. 5 listings raising S$19.7 million in 1H FY2025). Period-end total market capitalisation reached S$1,059.3 billion (+22.3% YoY). Retail participation at a four-year high. SGX 1H FY2026 Financial Results (4 February 2026). investor.sgx.com
- MAS launched a S$5 billion Equity Market Development Programme (EQDP) in 2025. The Equities Market Review Group (EMRG) released final recommendations in 1H FY2026, including consolidation of listing review functions under SGX RegCo and a new Global Listing Board in partnership with Nasdaq. SGX 1H FY2026 Financial Results; DBS Research – SGX SP. investor.sgx.com
- Equities – Cash net revenue grew 18.7% to S$392.7 million in FY2025. Securities daily average traded value (SDAV) increased 26.5% to S$1.34 billion. SGX FY2025 Annual Report. investor.sgx.com
- Equities – Derivatives net revenue grew 13.8% to S$345.9 million in FY2025. Equity derivative volumes grew 10.3% to 175.8 million contracts. SGX FY2025 Annual Report. investor.sgx.com
- OTC FX average daily volume (ADV) grew 28.5% to US$143 billion in FY2025 — the highest year-on-year ADV growth among peer exchanges. SGX FX is now among the top three exchange-backed OTC FX venues by volume globally. In 1H FY2026, SGX FX headline ADV increased 32.3% to US$180 billion. SGX FY2025 Results Presentation; SGX 1H FY2026 Financial Results. investor.sgx.com
- In 1H FY2026, market data revenue increased 15.5% to S$29.0 million (1H FY2025: S$25.1 million), mainly due to repricing and fee recoveries associated with additional data usage. Connectivity revenue increased 10.8% to S$46.3 million (1H FY2025: S$41.8 million), driven by higher co-location sales and repricing. SGX 1H FY2026 Financial Results. investor.sgx.com
- Adjusted NPAT margin improved from 45.3% in FY2024 to 47.0% in FY2025. Adjusted operating margin improved from 54.0% to 58.2%. SGX FY2025 Annual Report. investor.sgx.com
- Financial metrics sourced from: SGX FY2025 Annual Report (operating revenue, NPAT, dividend, EPS); StockAnalysis – SGX:S68 Statistics (P/E, D/E); Alpha Spread – SGX:S68 ROIC (33.7%). stockanalysis.com
- 1H FY2026 results (half-year ended 31 December 2025): Net revenue of S$695.4 million (+7.6% YoY); Adjusted NPAT of S$357.1 million (+11.6% YoY); Adjusted EPS of 33.4 cents (+11.7% YoY). Equities – Cash net revenue +16.2%; FICC net revenue +12.5%; currency derivatives volumes +17.6%; commodity derivatives volumes +24.2%; SDAV +19.5% to S$1.5 billion. 2Q FY2026 interim dividend of 11.0 cents per share (2Q FY2025: 9.0 cents). SGX 1H FY2026 Financial Results (4 February 2026). investor.sgx.com
- In 1H FY2026, SGX recorded a S$15 million impairment of goodwill allocated to the Indices Cash Generating Unit (CGU), attributable to the continued underperformance of Scientific Beta. SGX 1H FY2026 Financial Results; SGX 1H FY2026 Interim Financial Statements (Note 9). investor.sgx.com
- SGX's proposed FY2025 total dividend of 37.5 cents per share (+8.7% YoY), up from 34.5 cents in FY2024. The Board published a forward dividend schedule of quarterly increases of 0.25 cents from FY2026 through FY2028. SGX FY2025 Results Presentation. investor.sgx.com
- Debt-to-equity ratio of approximately 0.37x; current ratio of approximately 1.81x. SGX holds a positive net cash position relative to gross debt. StockAnalysis – SGX:S68 Statistics. stockanalysis.com
- In 1H FY2026, Equities – Derivatives net revenue declined 5.6% to S$167.4 million. Equity derivatives volumes were essentially flat at 90.8 million contracts (-0.4%). Japan Nikkei 225 volumes fell 24.2%; GIFT Nifty 50 volumes declined 5.5%; MSCI Singapore declined 9.0%. FTSE China A50 volumes rose 2.7%. SGX 1H FY2026 Financial Results. investor.sgx.com
- Equities – Derivatives segment revenue and operating profit data (FY2023–FY2025). Data aggregated using Fiscal.ai. fiscal.ai
Disclosure: Glavcot Insights and its contributors may hold positions in securities discussed in this article. All content is provided for informational and educational purposes only. Nothing published by Glavcot Insights constitutes investment advice. Readers should conduct their own research and consult qualified financial professionals before making investment decisions.
Glavcot Insights is an independent equity research publication founded by Ryan Gallinera and managed under Glavcot LLP, Singapore.
Glavcot Insights is an independent equity research publication founded by Ryan Gallinera and managed under Glavcot LLP, Singapore.
Where Clarity Meets Conviction
Glavcot Insights is now live. Join the free tier to get new research, updates, and future analysis directly in your inbox. (Check your spam folder if you don't see the confirmation email)