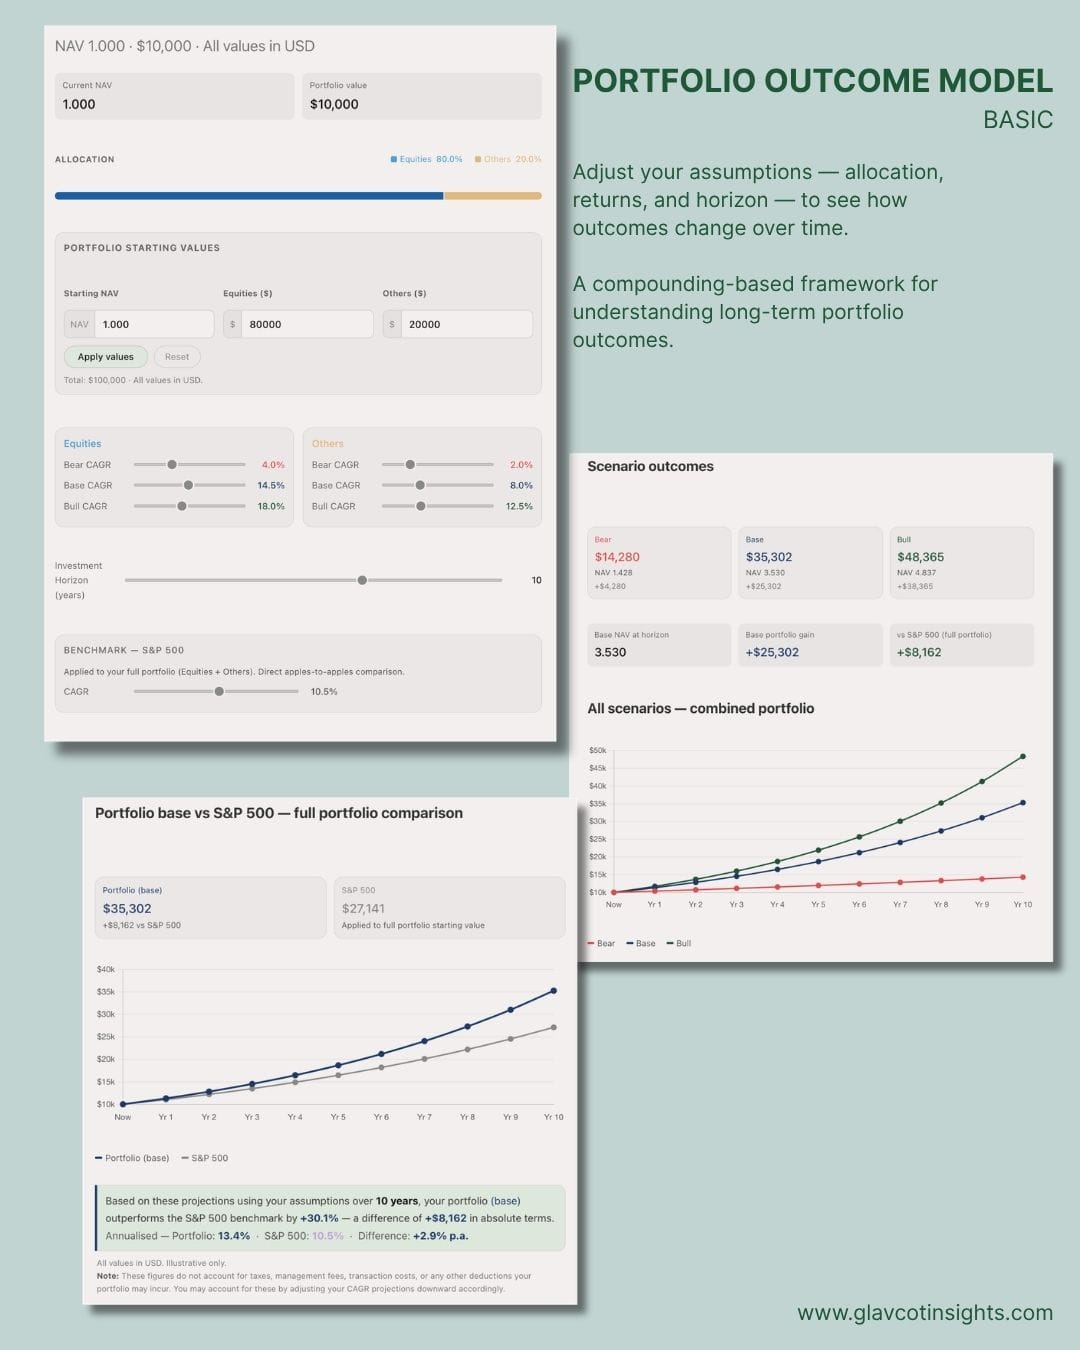
Adjust your assumptions — allocation and horizon — to see how outcomes change over time.
The benchmark defaults reflect a relatively optimistic 10-year CAGR. Adjust them to match your own assumptions.
The benchmark defaults reflect a relatively optimistic 10-year CAGR. Adjust them to match your own assumptions.
Glavcot Insights
Terms of Use — Portfolio Outcome Model
This Portfolio Outcome Model is developed by and remains the intellectual property of Glavcot LLP. Access is provided free of charge.
By clicking "I Understand & Agree", you acknowledge that this tool is provided for educational and illustrative purposes only. Outputs do not constitute financial advice, investment recommendations, or professional asset allocation guidance.
All projections are hypothetical and based solely on your inputs. Past performance is not indicative of future results. Glavcot LLP accepts no liability for any financial decisions made in reliance on this tool's outputs.
This tool does not account for taxes, fees, transaction costs, or any other deductions applicable to your circumstances.
Developed by Glavcot LLP · glavcotinsights.com
Portfolio Outcome Model (Basic)
A compounding-based framework for understanding long-term portfolio outcomes.
By Glavcot
Current NAV
Portfolio value
$2,000
Allocation
Equities 50%
Others 50%
Portfolio starting values
NAV
$
$
Total: $2,000 · All values in USD.
Equities
Bear CAGR4.0%
Base CAGR10.0%
Bull CAGR18.0%
Others
Bear CAGR2.0%
Base CAGR6.0%
Bull CAGR10.0%
Investment Horizon (years)
5
Benchmark — S&P 500
Applied to your full portfolio (Equities + Others). Direct apples-to-apples comparison.
CAGR
10.0%
Scenario outcomes
Base NAV at horizon
Base portfolio gain
—
vs S&P 500 (full portfolio)
—
All scenarios — combined portfolio
Bear
Base
Bull
Portfolio base vs S&P 500 — full portfolio comparison
Portfolio (base)
S&P 500
—
All values in USD. Illustrative only.
Note: These figures do not account for taxes, management fees, transaction costs, or any other deductions your portfolio may incur. You may account for these by adjusting your CAGR projections downward accordingly.
Legal Disclaimer & Terms of Use
This Portfolio Outcome Model is developed by and remains the intellectual property of Glavcot LLP. Access and use of this tool is provided free of charge. By using this tool, you agree to the terms set out below.
This tool is provided for educational and illustrative purposes only. Projections generated do not constitute financial advice, investment recommendations, or professional asset allocation guidance of any kind. They should not be used as a substitute for advice from a qualified and licensed financial adviser.
All figures are hypothetical and based solely on user-defined inputs. Past performance is not indicative of future results. No output from this tool should be treated as a definitive or guaranteed forecast of future portfolio value. Glavcot LLP accepts no liability for any financial decisions made, directly or indirectly, in reliance on the outputs of this tool.
Visit glavcotinsights.com for research and analysis.
Want the full model?
Explore full model →
Four allocation buckets, dividend yield inputs, 30-year horizon, multi-benchmark comparison.
How to use this model:
- Set your starting capital and allocation
- Adjust expected returns (CAGR) for each bucket
- Set your time horizon
- Compare outcomes against the benchmark
The results reflect your assumptions — not forecasts.
A note on CAGR inputs
CAGR inputs represent your expected total return — price appreciation plus any income reinvested.
Broad equity indices have historically delivered ~8–10% annually over long periods. Higher assumptions (e.g. 12–15%+) typically imply strong business performance or selective portfolio construction, rather than broad market returns.
Portfolios concentrated in high-quality compounders — businesses with durable advantages and reinvestment capacity — have historically achieved higher, though with commensurately higher selection risk.
Sustained outperformance over broad market benchmarks is uncommon.
The model is not designed to assume it — but to make clear what your assumptions require.
For a brief explanation on how to think about this, see:
CAGR Is The Number That Matters
There’s a version of this story that happens thousands of times a year — in Singapore, and in every market where fund marketing exists.

Three Lessons from 126 Years of Market History
Equities outperformed not because they are traded more frequently, analysed more thoroughly, or held by smarter investors. They outperformed because they represent ownership stakes in productive businesses — entities that generate earnings, reinvest capital, and compound value over time.

Members can access the Enhance model here.