Why Ownership Structure Matters More Than Most Investors Realize
This is Part 1 of a two-part series exploring how ownership structure shapes investment outcomes. In this first part, we'll establish the foundational framework—why ownership matters, the spectrum of ownership structures, and three key signals every investor should evaluate.
Not all slices are equal—and some hands have forks already in the pie.
Understanding the Ownership Composition of Your Stocks (Part 1)
This is Part 1 of a two-part series exploring how ownership structure shapes investment outcomes. In this first part, we'll establish the foundational framework—why ownership matters, the spectrum of ownership structures, and three key signals every investor should evaluate. Part 2 will dive deeper into advanced insights, including how to interpret ownership trends over time and detailed case studies of companies with different ownership dynamics.
The Missing Piece in Most Investment Analysis
You've done the work. Revenue growth checks out. Margins are expanding. Balance sheet is clean. Management has a track record. The business scores well on quality metrics.
But there's one more question that most investors skip:
Who owns this company, and what does that mean for you?
I learned this the hard way. Years ago, I kept finding companies that looked undervalued on every screener—trading at 12-15 P/E, decent returns, stable earnings. Everything pointed to "buy."
But month after month, nothing happened. The share price just sat there. When I finally dug into the ownership tabs, the pattern became clear: 15-18% public shares. The rest locked up in family holdings, private companies, strategic investors.
My realization: These controlling shareholders are essentially trading amongst themselves. The public market is just a side show. That's when I started treating ownership structure not as an afterthought, but as a critical context layer that shapes how—and whether—business value translates into shareholder returns.
This isn't about avoiding companies with concentrated ownership. It's about understanding what you're getting into and adjusting your expectations accordingly.
THE FRAMEWORK: Ownership Structure as Context, Not Veto
Think of ownership structure like climate when evaluating real estate.
A well-built house in a harsh climate isn't a bad investment—but you need different systems, different maintenance plans, different expectations than the same house in a temperate zone.
Similarly, a high-quality business with concentrated ownership isn't necessarily a bad investment—but you need different entry points, different timeframes, different catalysts than the same business with dispersed ownership.1
The principle:Fundamentals tell you if the business is good. Ownership structure tells you if and when that goodness translates to your returns.
THE OWNERSHIP STRUCTURE SPECTRUM
Singapore-listed companies fall across a spectrum based on public shares (ownership):
Low Public Ownership (Sub-25%): Controlled Market
Reality: This is barely a public company
Implication: You're a guest, not a partner
Medium Public Ownership (25-40%): Founder/Family Dominated
The key insight: There's no inherently "bad" zone—just different dynamics requiring different approaches.
This framework applies to public companies globally, not just Singapore. The examples here focus on Singapore-listed businesses, but the same ownership principles hold whether you're analyzing US tech stocks, European industrials, or Asian champions.
But first, Float vs. Ownership: What's the Difference?
Public ownership measures the percentage of a company held by public investors versus insiders—a structural indicator that reveals control dynamics regardless of company size.
Public float, by contrast, refers to the absolute number of shares available for trading (e.g., 10 million shares), which day traders monitor for volatility and liquidity. A mega-cap with 20% public ownership might have 200 million shares trading (high float, low ownership %), while a small-cap with 20% public ownership might have only 5 million shares trading (low float, low ownership %). This framework focuses on ownership percentage because it reveals who controls decisions and how value surfaces, not just trading liquidity.
Of course, public float is also a factor in share price dynamics. How absolute share count affects trading behavior and price volatility is a separate analytical dimension—one that may be explored in individual company analyses or as a standalone article.
THREE KEY SIGNALS TO EVALUATE
Once you've determined the business is fundamentally sound, evaluate ownership through these lenses:
SIGNAL 1: WHO OWNS THE MAJORITY?
The nature of major holders shapes everything.
Founder/Family Holdings
When founders own a significant personal stake—say 10-40% of the company—their personal wealth is directly tied to the company's market cap. They want share price appreciation not just for returns, but for ego, legacy, and estate planning.
What to look for: Are they buying more shares consistently? That's conviction. Are they only selling? That may be an exit signal.
Strategic Corporate Holders
When a strategic player takes a substantial stake—perhaps 20-30%—it's validation. These aren't financial investors flipping for quick gains. They see operational synergies, distribution networks, or strategic value that aligns with their own business.
What it means: Their presence adds stability. They have resources and expertise. They're not selling based on quarterly results.
SIGNAL 2: ARE INSIDERS BUYING OR SELLING?
This is the single most important behavioral signal.
When founders or management buy shares in the open market with their own money—not via options or grants—it's conviction. They're saying: "Current price is below what I believe this is worth."
Share buybacks tell the same story: Does management buy back shares when the stock is cheap? That confirms they see value.
Example: If a company trades below book value, generates strong cash flow, but management implements buybacks—they're putting capital where their conviction is. That's alignment.
Conversely, if insiders are only selling, or if a company sits well below book value for years without buybacks—management either doesn't believe it's undervalued, or doesn't care about share price. Both are concerning.
SIGNAL 3: WHAT'S THE PUBLIC OWNERSHIP COMPOSITION?
Medium with Mixed Ownership
When you see around 30-40% public ownership combined with significant founder ownership, a strategic holder, and some institutional presence—and insiders are buying or implementing buybacks—that's a workable structure.
Example: Food Empire Holdings
The company has roughly a third in public hands, with the founder holding a meaningful personal stake and a strategic group (Salim Group) holding another substantial portion. There's history of insider buying when the price was depressed.
What this suggests: Controlling shareholders collectively own the majority. They have the tools to surface value through dividends, buybacks, or strategic moves. When they act, the relatively concentrated ownership can amplify price impact. If you're aligned with their timeline and the business is sound, you can position to benefit.
The consideration: This requires patience—potentially several years—but when aligned insiders move, the impact can be magnified.
-------
Low Public Ownership (Sub-25%)
At this level, you're essentially renting shares. Controlling blocks rarely trade. Price movements reflect thin retail sentiment, not business fundamentals.
Considerations for low ownership structures: Different analytical lenses reveal different aspects of this structure:
Income analysis: Dividend yield becomes a primary consideration when distributions are substantial
Catalyst evaluation: Specific events (secondary offerings, index inclusion) can shift dynamics materially
Asset-based valuation: Underlying asset backing provides context for downside protection
With very low public ownership and no dividends, retail investors are dependent on controlling blocks' decisions. Without a specific catalyst on the horizon, the opportunity cost of inactive capital becomes a relevant consideration.
-------
High Public Ownership (Above 40%)
This is institutional-grade structure. Price discovery functions efficiently. Liquidity exists for entering and exiting positions. But the trade-off: you're less likely to find severe mispricings.
Example: DBS Bank
The bank has substantial public shares with a diversified holder base, index inclusion, and liquid daily trading.2 The valuation reflects this accessibility, not just business quality.
What this means: You get transparency and liquidity, but you typically pay fair value. Upside comes from business execution, not structural discount.
What we're looking for basically... When evaluating ownership, we're looking for evidence of genuine conviction and aligned interests. Do the CEO and board members hold meaningful stakes in the company—and more importantly, are they buying more shares with their own money? That's skin in the game. When insiders are accumulating shares or implementing buybacks when prices are depressed, they're signaling belief in value that the market hasn't recognized yet.
Strong institutional backing also matters—when established fund managers hold substantial positions, it indicates the business has passed rigorous due diligence, even if it's not a household name. But here's the nuance: concentrated ownership or heavy institutional presence doesn't automatically make something investable or uninvestable. A company with only 20% public float can may present different considerations if controlling shareholders are actively working to surface value through dividends, buybacks, or strategic moves.Conversely, a company with 50% institutional ownership might see sharp price swings based on fund rebalancing that has nothing to do with business performance.
The goal is understanding the dynamics at play—who controls decisions, what motivates them, and how those factors shape the path from business value to shareholder returns. It's not about finding the "right" ownership structure; it's about knowing which game you're playing and whether the timeline, catalysts, and risks match your investment approach.
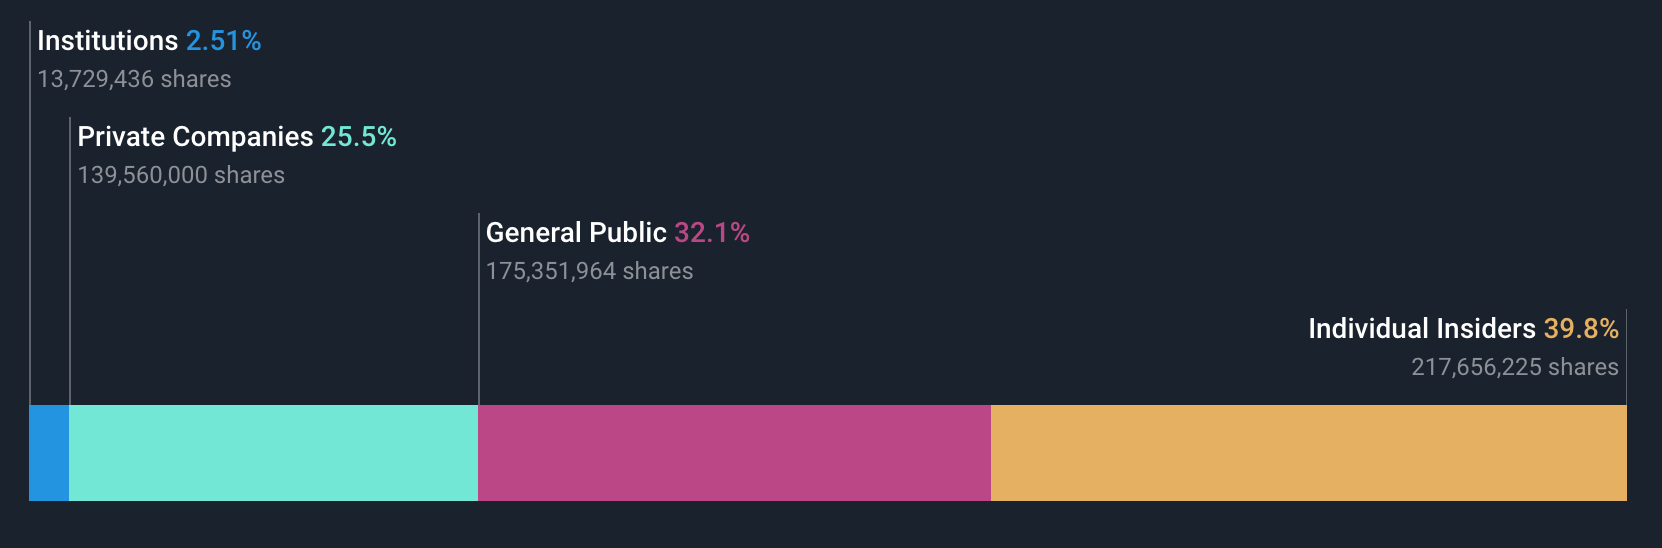
CASE STUDY: Food Empire Holdings
The company has meaningful public shares alongside concentrated insider and strategic ownership. Salim Group—a strategic player with deep knowledge of food and beverage distribution across emerging Asia—is the largest shareholder. Executive Chairman and founder Tan Wang Cheow holds a substantial personal stake, as does CEO Sudeep Nair, creating strong alignment with long-term shareholder interests.3
Ownership Breakdown (Dec 2025)
Reading the signals:
This significant stake means alignment. Their wealth is tied to the company's success. Salim Group's presence validates the business—they understand the regional dynamics. There's history of insider buying when prices were depressed.
The implication: When the business performs—expanding in emerging markets, improving margins—insiders who collectively control the majority can surface value through dividends, buybacks, or strategic announcements. The concentrated ownership means when they move, price impact can be amplified.
This structure reflects multi-year horizon and trust insider judgment. You're positioning to benefit when controlling shareholders act.
CONCLUSION TO PART 1
These three signals—who owns the majority, insider buying behavior, and public float composition—give you the foundation for understanding ownership dynamics.
But there are two more critical signals that reveal how ownership structure plays out over time, plus deeper case studies showing these dynamics in action across different companies.
In Part 2, we'll explore:
How to interpret public shares trends over time
What major holder behavior during stress reveals
Detailed case studies across different ownership structures
How to put it all together into a practical framework
Understanding ownership structure isn't about finding reasons not to invest. It's about knowing which game you're playing—and making sure your expectations match the reality.
For detailed company analyses that evaluate both fundamental quality and ownership structure, explore the research at The Insights Library.
References:
1. Research on institutional investor behavior shows that portfolio rebalancing, redemptions, and changes in investment mandates can create significant price movements independent of company fundamentals. See: Abarbanell, J., Bushee, B., & Raedy, J. (1998). "The Effects of Institutional Investor Preferences on Ownership Changes and Stock Prices Around Corporate Spin-Offs." Available at SSRN; and "The effects of concentration in the asset management industry on stock prices," CEPR (2019). ↩︎
2. Singapore Exchange requires a minimum 10% public float for mainboard listings. Source: SGX Listing Rules, Rule 1307 - Free Float requirements. ↩︎
3. Data ownership structure from Simply Wall St,.https://simplywall.st/stocks/sg/food-beverage-tobacco/sgx-f03/food-empire-holdings-shares/ownership
4. Disclosure: Glavcot Insights and its contributors may hold positions in securities discussed in this article. All content is provided for informational and educational purposes only. This is not investment advice—readers should perform independent research and consult financial professionals before making investment decisions.
Where Clarity Meets Conviction
Glavcot Insights is now live. Join the free tier to get new research, updates, and future analysis directly in your inbox. (Check your spam folder if you don't see the confirmation email)
You might also like
Feb 06
Warren Buffett Doesn't Buy Gold. Over the Past Decade, That Would Have Been a Mistake.
— Unless you could do what he does.
A close friend asked me recently: "How does Glavcot Insights actually help
5 min read
Jan 01
TAYLOR SWIFT: THE ECONOMICS OF OVER-SERVING
"It is our job to make this look accidental, and it is our job to make this look effortless. I don't think of this as the pieces falling into place. You PUT the pieces where they are."
— Taylor Swift to her dancers and co-performers,The Eras Tour (Taylor's Version) documentary
That stopped me.
8 min read
Dec 23
The Book Value Trap
Why 57% of SGX companies trading below book value aren't bargains—and what metrics actually reveal business quality for Singapore investors.
1 min read
Dec 19
Reading Ownership Composition: Advanced Insights
This is Part 2 of a two-part series on ownership structure. In Part 1, we explored why ownership matters and introduced three foundational signals every investor should evaluate. Here, we dive deeper—examining how ownership dynamics evolve over time
9 min read
Dec 01
The Ticker Isn't the Business: Why Share Prices Tell You Less Than You Think
Most investors treat share prices like gospel. Down 15% in three months? Panic. Up 20% in a week? Euphoria. But here's what the market won't tell you: the price you see flashing across your screen is determined by less than 1% of the company's shares actually changing hands.